Perf Event Counters
Ark allows you to connect to the Linux kernel perf event counter infrastructure and log / process said information. The APIs are broken into two major groups:
- the collection APIs
- the decoding APIs
Further, a ark::perf::PerfEventCollectorStage exists to handle collection and output of counter
data on your behalf. It’s likely you just want to use that stage.
Because the amount of trace data that can be collected can be quite large, both the stage and collection APIs are just focused on capturing the data without further processing. A separate set of APIs and tools can be used to parse that data into something usable.
The most common use case for this at the moment is looking at things like the schedstat counters,
which can help you debug scheduling issues and latency caused by preemption. Here is an example
output:
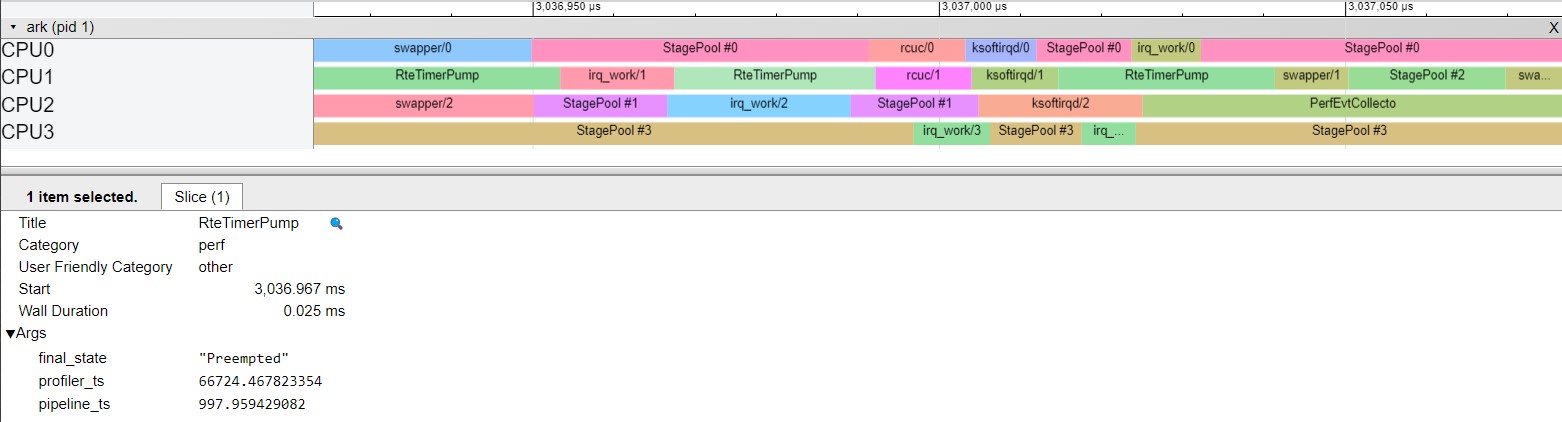
In this trace, you can see that four CPU cores are active. Work being executed on the stage pools
is proceeding as expected, although they are being interrupted by other kernel work. Notably, the
RteTimerPump, which is responsible for scheduling timer executions, is prempted twice by higher
priority kernel jobs – the first time, by irq_work/1, and the second time, by rcuc/1 and `ksoftirqd/1'.
If this added latency is unacceptable, you can consider re-assigning interrupts and tasks to avoid this conflict.
Tools
You can make use of the ark-stream-perf-events tool to both test out streaming events from your
local kernel or from data logs.
./build/ark-stream-perf-events -e sched/sched_switch
Will stream sched/sched_switch events from the kernel and output the results to the screen. You
can use the -l option to stream from a log instead of the kernel.
The ark-stream-perf-events tool can also be used to generate a tool suitable for loading in Chrome’s
tracing tool. Use the --json-report flag to output such a report.
Permissions
Note that you will likely need to adjust permissions to allow collection of this data. By default, only root can capture this data.
Please see documentation around /proc/sys/kernel/perf_event_paranoid to decide what parameters
are useful here. You will also likely need to adjust the groups or permissions on the /sys/tracing/kernel
tree to allow the software to read event format and identifier information.
For an example of how we do this in ArkOS, see these two files:
ark/arkos/configs/generic/overlay/etc/sysctl.d/15-perf-event-paranoid.confark/arkos/configs/generic/overlay/etc/systemd/system/ark-tracing.service
The first adjusts permissions to allow processes to capture events, and the second ensures the tracing filesystem is exposed with permissions such that the pipeline is allowed to capture data on it.
This is typically locked down due to security concerns; please make sure you understand the ramifications of adjusting these parameters before doing so in production.
Basic API Example
The APIs that are available are largely simple wrappers around the equivalent kernel APIs. As an example of collecting data:
#include "ark/perf/perf_event_handle.hh"
#include "ark/perf/perf_event_decoder.hh"

// First, we need to create a 'schema' that holds formatting and configuration
// information.
auto schema = perf::create_perf_event_schema("sched/sched_switch");

// Next, we can create a handle to it. You can configure a handle to either attach
// to a specific CPU, or to a particular PID/TID. In this case, we'll just create
// one handle and connect to PID 1000.
perf::PerfEventHandleConfig config;

config.schema = schema;
config.cpu = -1;
config.pid = 1000;

perf::PerfEventHandle handle(config);

// At this point you can enable it. This causes the kernel to start streaming data.
handle.enable();

// You can poll on the handle, or just read it's ring buffer. We'll read what it has
// captured so far, but you'll likely need to poll/wait a bit in the real world.
auto raw_bytes = handle.read();
Now that you have raw data, you probably want to decode it. Ark has a few built-in decoders that can assist with this:
auto decoded_samples = perf::decode_perf_event_samples(schema, raw_bytes);

perf::SchedSwitchDecoder decoder(schema);

// For each sample, let's decode it and print out what's going on.
for (const auto &sample : decoded_samples.samples)
{
    auto counter = decoder.decode(sample.raw_data);

    std::cout << sample.time << ": " << counter.prev_comm << " -> " << counter.next_comm << std::endl;
}
The above example takes in the raw bytes read above and decodes them into individual samples. This
gives you common data like timestamps, but you then need to further decode them based on the actual
data being captured. In this case, these are sched_switch events, so we can decode them with the
perf::SchedSwitchDecoder.
Logs
The PerfEventCollectorStage will collect data and emit it as a series of perf::PerfEventDataBatch objects.
These contain the schema and ring buffer bytes that we saw above (in other words, you can decode the samples
in the log the same you decode samples from the live system – it is the same data).
A helper API exists to convert the rbuf-stored schema into a decoder schema (perf::from_data_schema).