Tracing Scopes
Ark comes with a light-weight profiler (and system to both emit reports and log that profiling data).
The primary concept is built around ‘scopes’ – you start and stop scopes around code that needs to be profiled. At the moment, the overhead of using a scope is around 400ns, making it suitable for smaller functions, but not incredibly small functions.
As an example of using scopes:
#include "ark/perf/tracer.hh"

{
    PROFILER_START_SCOPE("my_trace_name");
    do_some_work();
}
In this case, the scoped profiler will exit automatically when your scope exits. This can be very useful in code that throws exceptions or has many different exit conditions.
If you truly know your code cannot do that, you can use the manual START/STOP
variants:
#include "ark/perf/tracer.hh"

PROFILER_START("my_trace_name");
PROFILER_STOP();
Scopes can be nested within each other without issue. Additionally, if you point them at a constant string, they will be slightly faster (dynamic strings cause the profiler to store a copy of that string in a global hash table).
These scopes are all collected on a thread-local basis. To collect all of the scopes
that have been captured to date, access the TracerHost singleton:
auto scopes = TracerHost::instance().flush();
This will return a list of packed timing information. Typically, the individual threads
do not interact with the TracerHost unless you invoke flush. The exception to this is
if a thread exits – in that case, it will do one final push to the tracer host so that
no data is lost.
It is anticipated that only one thread is calling flush at a time. Once you call
flush, you gain ownership of the logged scopes.
Reporting
A simple TracerReport class exists to help you summarize or emit reports on your
scopes. You can do one of two things with this class:
- emit a summary of scopes (min/max/averages)
- emit a Chrome “tracing” style report
See this example:
#include "ark/perf/tracer_report.hh"

auto scopes = TracerHost::instance().flush();

TracerReport report;

report.add_scopes(scopes);

std::cout << report.summary();
That will yield a summary that looks something like:
MIN        MAX        AVG        COUNT   NAME
0.000026   0.000320   0.000054   281     CairoRendererStage:/gui/renderer_layer
0.048303   0.074604   0.061398   278     CairoRendererStage:periodic_timer
0.004006   0.005086   0.004306   281     DataCollectionRendererStage:/velodyne/packet_group
0.000253   0.002432   0.000388   281     LogReaderStage:event_timer
0.000000   0.000064   0.000001   1420    LogReaderStage:periodic_timer
0.000059   0.000086   0.000070   5       TracerCollectorStage:periodic_timer
0.001520   0.029150   0.001925   278     VideoEncodingStage:/cairo/frame
The Chrome “tracing” report is a JSON file that contains data suitable for loading into the tracing extension of Chrome. This allows you to view a timeline of profiled events, such as:
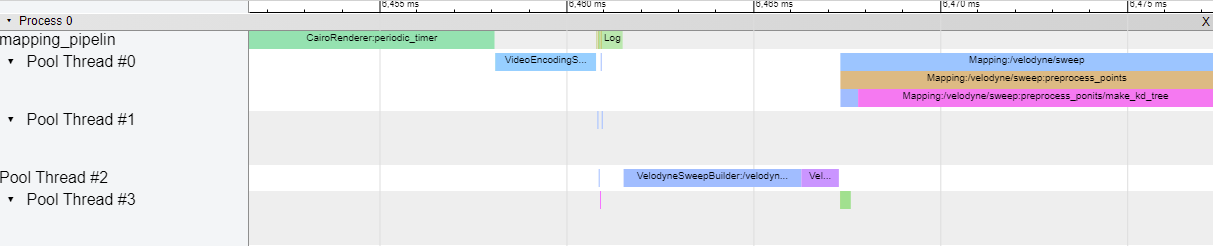
This is useful for checking to see which routines are running in parallel, distances between executions, or generally deep diving around a particular event to get a sense of what the system was doing.
You can access the Chrome tracer by visiting the chrome://tracing URL.
Command Line
Everything in the reporting section can be accessed through the ark-perftool command.
This allows you to process a log and generate either a summary report or a Chrome JSON
trace.
For example:
./build/ark-perftool ~/logs/manifests/be0acc88-5dab-442f-846f-3b16649ced54 --summarize
MIN         MAX         AVG         TSMAX         COUNT   NAME
0.000001    0.000004    0.000001    3527.074220   125     AnnotationStage:/time/time_model
0.000027    0.000041    0.000034    3529.559334   13      CategoryStage:periodic_timer
0.000001    0.000009    0.000002    3505.559333   62      ConfigPackageStage:periodic_timer
0.000007    0.000187    0.000013    3558.559407   125     FaultStage:/invader/statistics
0.000044    0.000140    0.000064    3486.675327   118     FaultStage:/logger/statistics
Logging
See the documentation on the Tracer Collector Stage for more information.